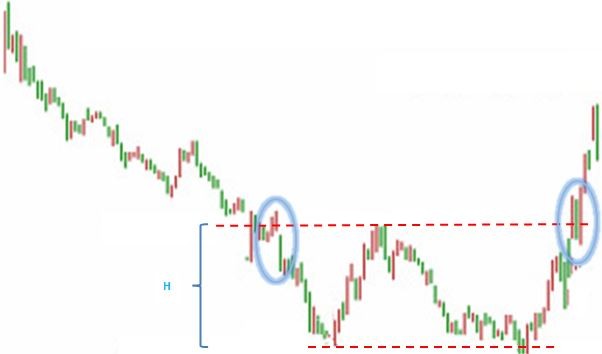
What does a double bottom signal?
A double bottom is a reversal pattern very similar to the reverse head and shoulders pattern and is often seen when trading currencies. Double bottom patterns are identified by two low prices of the same depth with a medium-sized pullback in between. Double bottoms can be a major reversal pattern that often follows a longer downtrend. When you confirm that this pattern is occurring, and there is a significant amount of volume below the uptrend, it is time to “go long”.
 Here is the general shape of a double bottom pattern. As with most technical analysis patterns, they are a guideline but may differ from this graph to a degree. What is important to note is: 1. The pattern starts with a strong downtrend (the stronger the trend, the better the reversal) 2. The lower points should be roughly at the same height (most consider about 10 – 20% to be acceptable) 3. At the second circle in the image above, the line should be traced at the top of the pullback. 4. many consider the height (h in the digram) to be the height that the trend will go above the top line and will place their limit or stop orders accordingly. There should also be significant volume as the stock breaks to the upside; you may get a “False Flag” if you see something similar to this pattern, but no increase in volume near the close to signal that the reversal is real.
About the Vikingen
With Vikingen’s signals, you have a good chance of finding the winners and selling in time. There are many securities. With Vikingen’s autopilots or tables, you can sort out the most interesting ETFs, stocks, options, warrants, funds, and so on. Vikingen is one of Sweden’s oldest equity research programs.
Click here to see what Vikingen offers: Detailed comparison – Stock market program for those who want to get even richer (vikingen.se)


