StockCharts365.com looks at Yara International ASA!

Yara International ASA – in this week’s analysis of StockCharts365.com!
In this week’s Analysis of the Week, StockCharts365.com has taken a closer look at one of the major companies listed on the Oslo Stock Exchange, Yara International ASA (ticker on Oslo Børs: YAR).
The Yara share has recently triggered several positive technical signals, and further gains are now being signaled for the share in both the short and long term.
More information and technical analysis for Yara International below.
Vikingen Investment School in week 45, US elections!
Here you will find our comments for week 45:
MPC Container Ships we choose to keep, a long-term good stock that is moving up again.
NVIDIA we hold and follow what happens in the election.
Marex Group (MRX) we buy, a company in the US comparable to Investor. Long-term good.
Serstech – we keep, the company looks good in Vikingen and secures a large Chilean order.
Two stocks we are keeping a close eye on now: Procept BioRobotics (PRCT) and Verona Pharma ADR (VRNA).
Week 44 we bought these shares, which we sold before the weekend
Bonesupport Holding AB (Bonex) medical technology company with good development right now
AAK AB, industrial company within vegetable fats and oils
Surgical Science Sweden AB (SUS), the company develops VR simulators for surgery
Isofol We sold when the share fell again.
QMMM stepped a lot and met resistance. We sold before the weekend.
We’ve learned to follow developments more closely than before and to be prepared to sell. This is always important and especially when big events happen, like the US election.
That was this week’s investment school.
Feel free to give us feedback and follow us on FB and/or Linkedin.
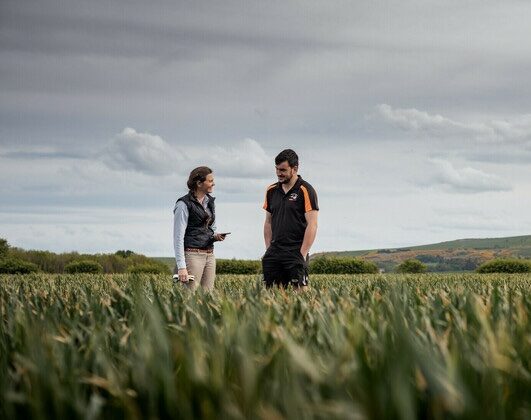
Below information about the company, Yara International ASA
(ticker on the Oslo Stock Exchange: YAR).
Yara International ASA (ticker on Oslo Børs: YAR), often referred to simply as Yara is a Norwegian fertilizer and chemical company with approximately 18,000 employees at the end of 2023. The company consists of three segments: sales and marketing of fertilizer products and solutions for agriculture, industrial and environmental solutions and manufacturing. The company was previously part of Norsk Hydro. It was listed as a separate company on March 25, 2004.
Key facts:
Established as Norsk Hydro in 1905
Spun off as Yara International ASA in 2004
CEO: Svein Tore Holsether
Headquartered in Oslo, Norway
Listed on the Oslo Stock Exchange (ticker: YAR)
Around 18,000 employees
Operations in more than 60 countries
Key figures:
Revenue: USD 15.5 billion
EBITDA: USD 1.7 billion
Total deliveries: 30.1 million tons
Fertilizer deliveries: 22.3 million tons
Industrial product deliveries: 6.4 million tons
Ammonia trade: 3.4 million tons
For more information about the company, visit their website here.
Technical Analysis of Yara International ASA
(ticker on Oslo Stock Exchange: YAR)
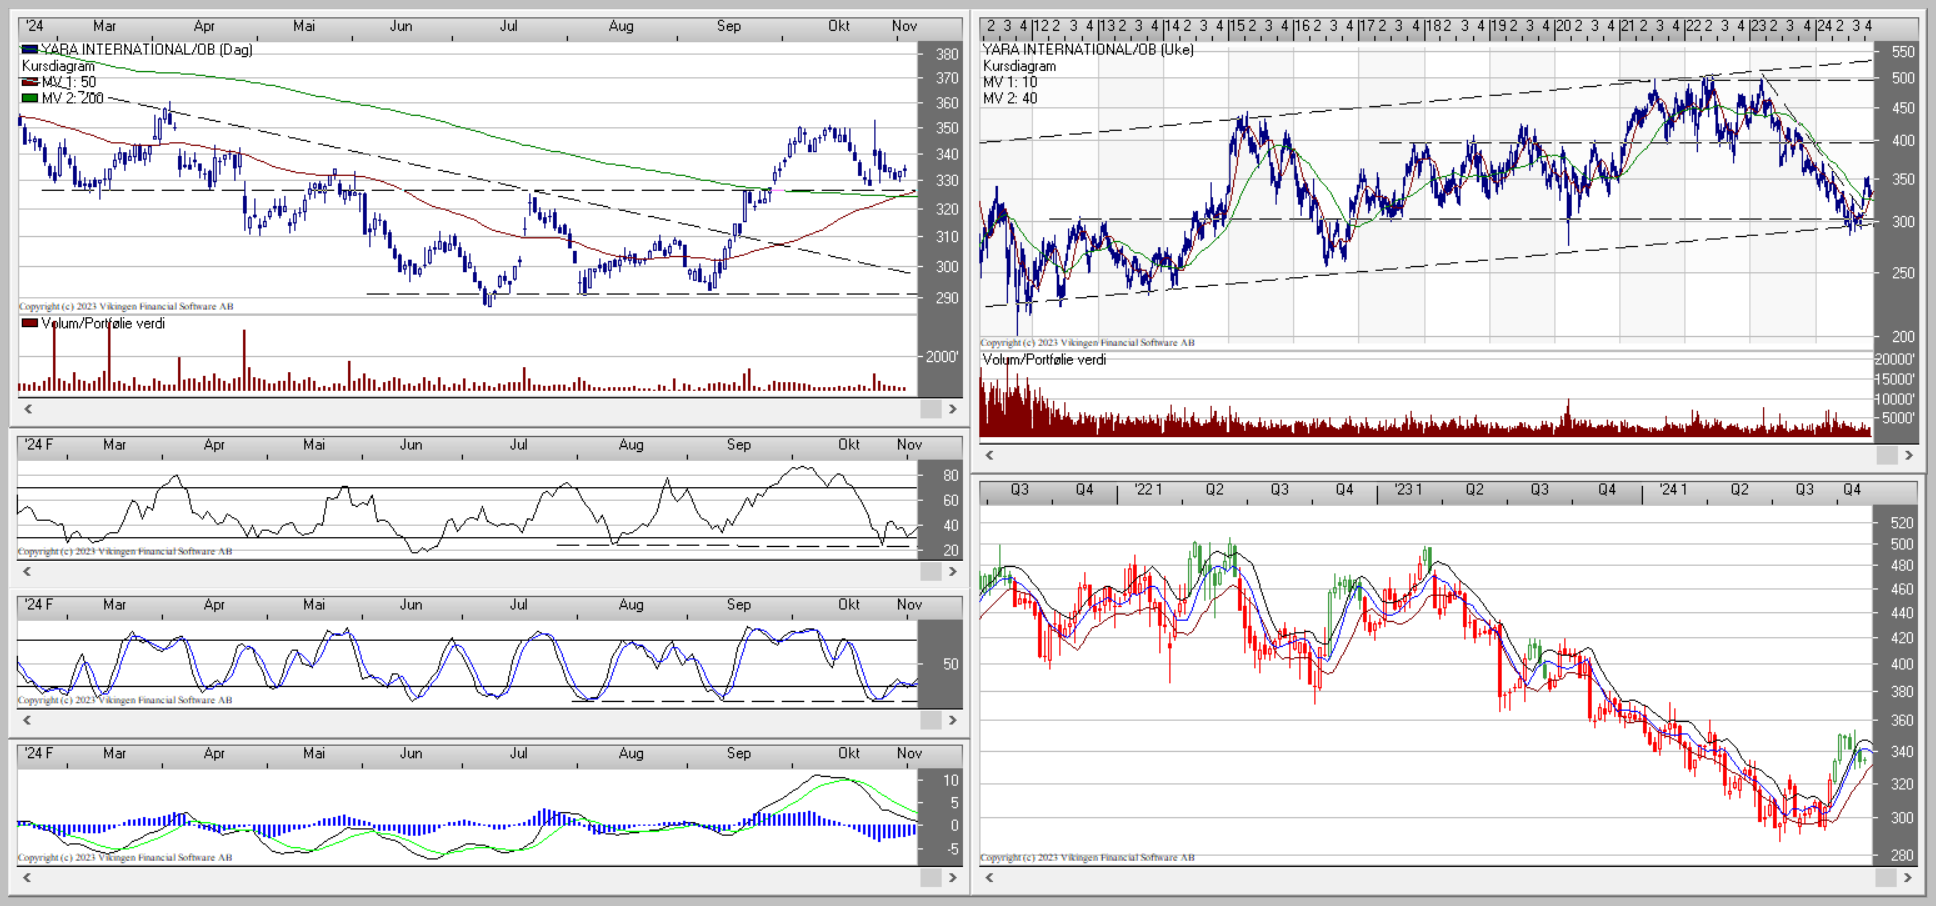
If we look at the very big picture for the Yara share (cf. weekly chart from Vikingen above), the share is in a long-term rising trend. The stock has now recently broken out of a falling trend that started at the beginning of 2023. Furthermore, the stock has broken above both the 50-day and 200-day moving averages. Then the 50-day moving average has broken above the 200-day moving average (the so-called Golden Cross Signal), which is an important signal indicating that both the short-term and medium-term trend has turned from negative to positive. Various momentum indicators such as RSI and Stochastics also signal that the stock may now be on the verge of further short-term gains. The stock has fallen back a little in the very short term, but is now finding significant technical support around the NOK 325.00 level, where there is also support down towards both the 50-day and 200-day moving averages.
Also the BEST model in Vikingen give a buy signal for the Yara share!
Furthermore, the BEST model in Vikingen provides a buy signal for Yara. This popular and effective technical analysis model was developed by Peter Östevik. He finalized the BEST model around 2019, and after 30 years of experience with technical analysis and Vikingen Financial Software.
The overall positive technical picture that the Yara share is now showing initially indicates a potential to around the NOK 400.00 level. Should the share break above the NOK 400.00 level, a further rise towards previous peaks around NOK 500.00 will be signaled. What could possibly change the currently positive technical picture that the Yara share shows would be if the share were to break below the now important technical support level around NOK 325.00, and below the 50-day and 200-day moving averages.

StockCharts365.com is not alone and see opportunities with Yara!
28 Oct. 2024 08:36 ∙ Finwire, Pareto Securities raises target price for Yara to 425 kroner (400), reiterates Buy
28 Oct. 2024 06:52 ∙ Finwire, SEB raises target price for Yara to 400 kroner (380), reiterates buy – BN
What is Vikingen Investment School?
Vikingen Investment School (the content of which we talk about in this blog) started on May 13, 2024. We have chosen to invest 10,000 SEK and hope that you will join us to learn how to get rich(er) on the stock market. If you have more than SEK 10,000 to invest, it’s of course even more interesting, but the principles are the same. Through Vikingen Financial Software and our mentor Peter Östevik, we at Vikingen Investment School select the investment objects that are most worth buying here and now. Since 10/6, we’re adding even more value to the blog by adding “Analysis of the week” from StockCharts365. com. And since week 41, there is a link to Børsprat in this blog.
Vikingen Financial Software reminds you that past performance does not always indicate future profits and that
all trading is at your own risk.
Sincerely, Catrin Abrahamsson-Beynon
