Link Mobility Group in this week’s analysis of StockCharts365.com!

In the Analysis of the Week by StockCharts365.com: Link Mobility Group ASA
In the ‘Analysis of the Week’, StockCharts365.com takes a closer look at an exciting company on the Oslo Stock Exchange, LINK Mobility Group ASA (ticker on the Oslo Stock Exchange: LINK).
The overall technical picture is now signalling further upside for the LINK share, which may have significant potential over the next 3-9 months. Read more about it below here, under the technical analysis.
But first the weekly update on Vikingen Investment School.
Vikingen Investment Schools week 36
The Nordic stock markets are relatively quiet, so this week we have chosen to look west. We have bought, sold and retained the following:
MPC Container Ships we choose to keep and even increase MPC
NVIDIA we choose to retain, and are waiting for the company’s next trip up
Neobo Fastigheter AB we choose to retain, with some hesitation
Ambea AB and Meko AB, we have chosen to sell both these shares. Meko showed a strong sell signal in Vikingen and there is a great risk that Ambea will also fall back.
We have chosen to acquire Compass Therapeutics, which is listed on Nasdaq and showing a strong uptrend (Ticker CMPX). The share is in our price range.
It was the investment school of the week. Feel free to give us feedback and follow us on FB and/or Linkedin.
Below about the company, LINK Mobility Group ASA (ticker on Oslo Stock Exchange: LINK)

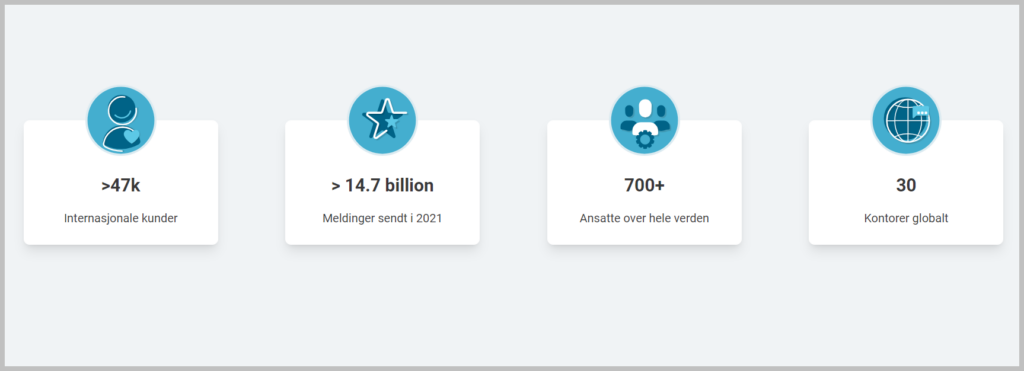
LINK Mobility Group Holding is active in the technology industry and is one of Europe’s leading providers of mobile communications and Communications Platform as a Service (CPaaS) solutions, based on volume of messaging, customer engagement serving enterprise, SME and government customers. The software is proprietary and is mainly used for communication, sharing and to integrate information flows.
Its customers consist of corporate customers operating in a number of different sectors. In addition to the main business, various value-added services are also offered.
The largest area of business comes from the Nordic market. For more information about the company, visit their website here
Technical Analysis of LINK Mobility Group ASA (ticker on Oslo Børs: LINK)

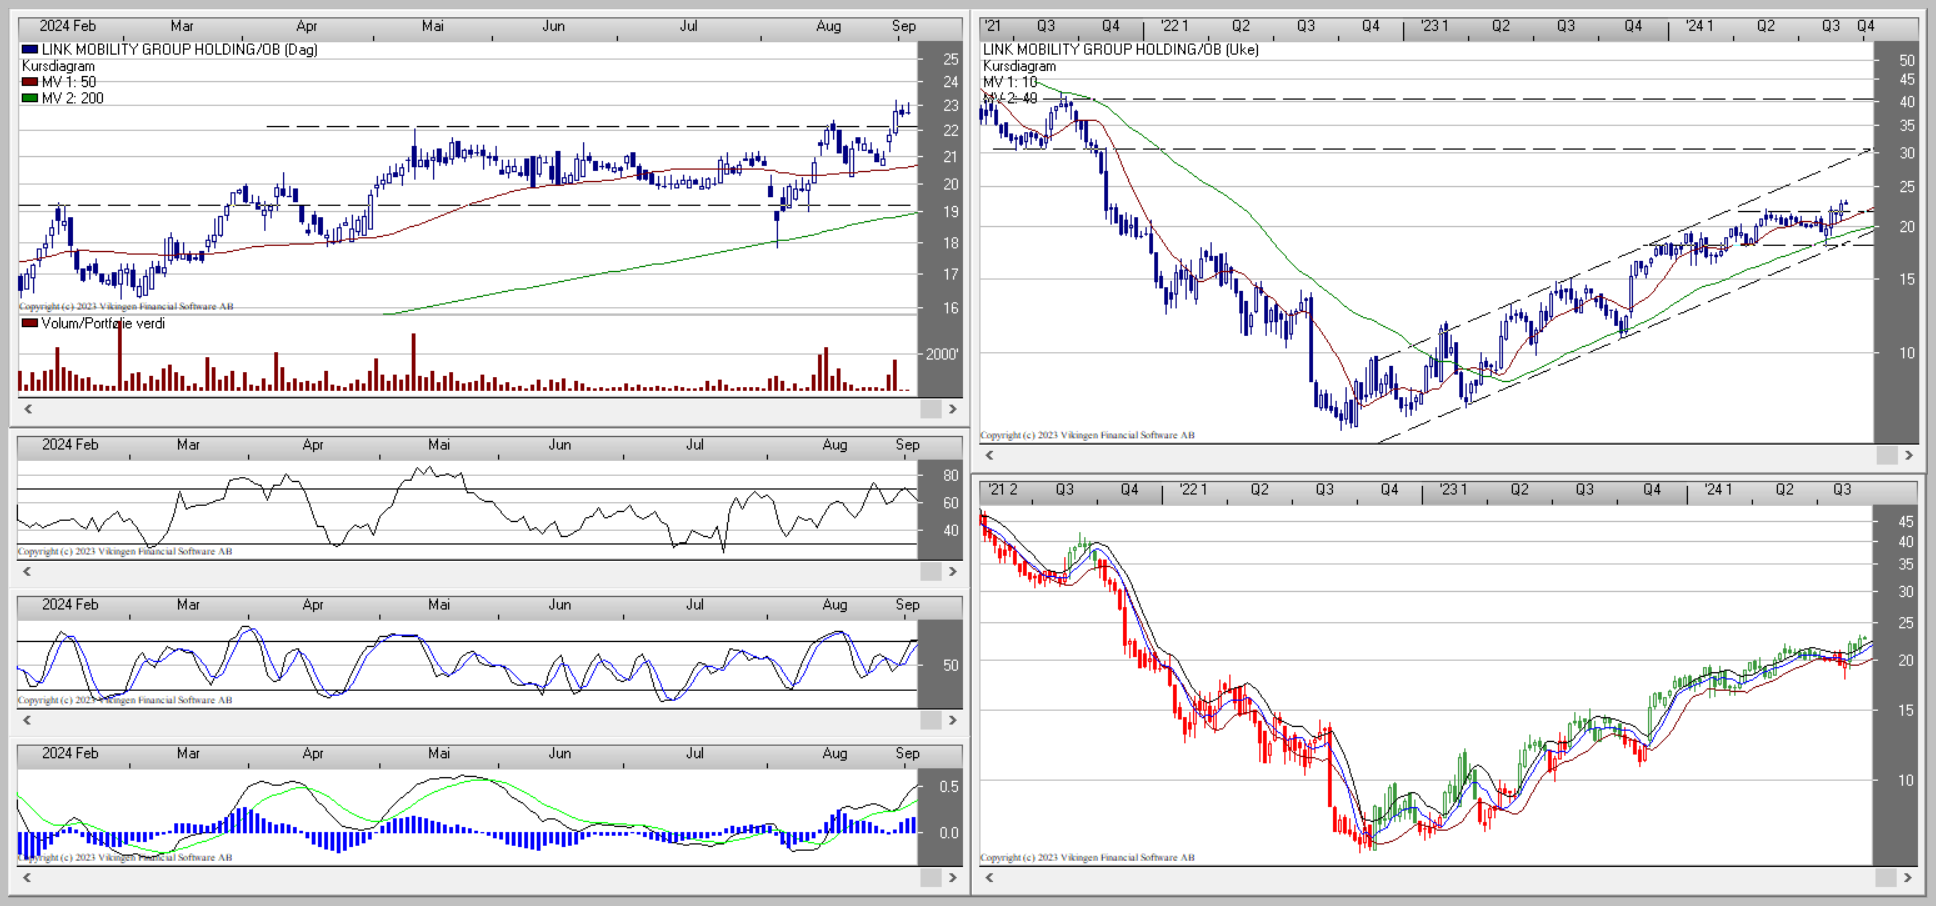
The LINK share shows a positive development within a long-term rising trend, which started at the beginning of 2023.
The stock is above both the 50-day and 200-day moving averages, and the 50-day moving average is above the 200-day moving average. This confirms that both the short-term and long-term trend for the stock is positive.
A new buy signal has now been triggered for the LINK share in recent days, following a break upwards from a rectangle consolidation formation.
The BEST model in Vikingen is also indicating a buy signal for the LINK share
The BEST model in Vikingen is also showing a buy signal for the LINK share.
This popular and effective technical analysis model has been developed by Peter Östevik. He finalized the BEST model around 2019, and after 30 years of experience with technical analysis and Vikingen Financial Software.
The LINK share is now encountering little technical resistance until the upper trend line of the long-term rising trend.
This indicates a potential for the share to reach around NOK 30.00 – 40.00 over a 3-9 month horizon.
The share is currently trading at around NOK 22.70, and may thus have significant potential over the next 3-9 months.
From Hold to Buy for Link
StockCharts365.com is not alone in having faith in LINK’s stock going forward, with Carnegie recently upgrading the stock from Hold to Buy with a new price target of NOK 30.00.
LINK: CARNEGIE UPGRADES TO BUY FROM HOLD, TARGET PRICE 30 (14) 29 Aug. 08:58 – Oslo (Infront TDN Direkt) Carnegie upgrades Link Mobility to a buy recommendation, from hold, and raises its price target to NOK 30 per share, from NOK 14.
The change follows a change of analyst at the brokerage house. This was stated in an update from the brokerage on Thursday. Carnegie expects a compound average growth rate (CAGR) in organic gross profit of 10 percent in 2024-2026, which combined with cost discipline and operational leverage results in an average growth in adjusted ebitda of 13 percent in the same period. Source.
What is Vikingen Investment School?
Vikingen Investment School started May 13th 2024.
We have chosen to invest SEK 10,000 and hope that you will join us to learn how to get rich(er) in the stock market.
Our ambition is that you will want to join us on our journey from beginner to experienced investor.
If you have more than SEK 10,000 to invest, it’s of course even more interesting, but the principles are the same.
Since 10/6, we’re adding even more value to the blog by adding “Analysis of the week” from StockCharts365. com.
Vikingen Financial Software shows the way!
Through Vikingen Financial Software and our mentor Peter Östevik, we at Vikingen Investment School select the shares/other investment objects that are most worth buying here and now.
Vikingen Financial Software would like to remind you that past positive results do not always indicate future profits and that all trading is at your own risk.
Sincerely, Catrin Abrahamsson-Beynon


