Intrum in this week’s analysis by StockCharts365.com


Intrum in the analysis of the week by StockCharts365.com
In the ‘Analysis of the Week’, StockCharts365.com takes a closer look at Intrum AB (ticker on Nasdaq Stockholm: INTRUM).
The Intrum share fell sharply some time ago from around SEK 300.00 in 2021/2022 to a low of around SEK 12.00 in March 2024. However, several positive technical signals have now been triggered for the Intrum share which could mean further gains in the short and medium term. Read more below.
First an update about Vikingens Investment School.
Vikingen Investment School’s holdings week 35
The interest rate has been lowered by the Swedish Riksbank and more interest rate cuts are expected, which will then stimulate an increase in the stock markets i during the fall. This week we have increased, purchased and kept the following.
MPC Container Ships we choose to keep and even increase
NVIDIA we choose to keep, the stock now shows signs of an upward trend again
We acquired Ambea AB, Neobo Fastigheter AB and Meko AB all of them show a strong trend in Vikingen.
It was the investment school of the week. Feel free to give us feedback and follow us on FB and/or Linkedin.
Below some information about Intrum AB
Intrum is active in the financial services industry. The company specializes in the management of credit processing services, focusing on invoice purchasing, credit information and invoicing related issues. Intrum was founded in 1924 and operates in the European market, with small and medium-sized corporate customers as its base. The head office is located in Stockholm.
For more information about the company, visit their website here
Technical Analysis of Intrum AB below
Technical Analysis of Intrum AB (ticker on Nasdaq Stockholm: INTRUM)
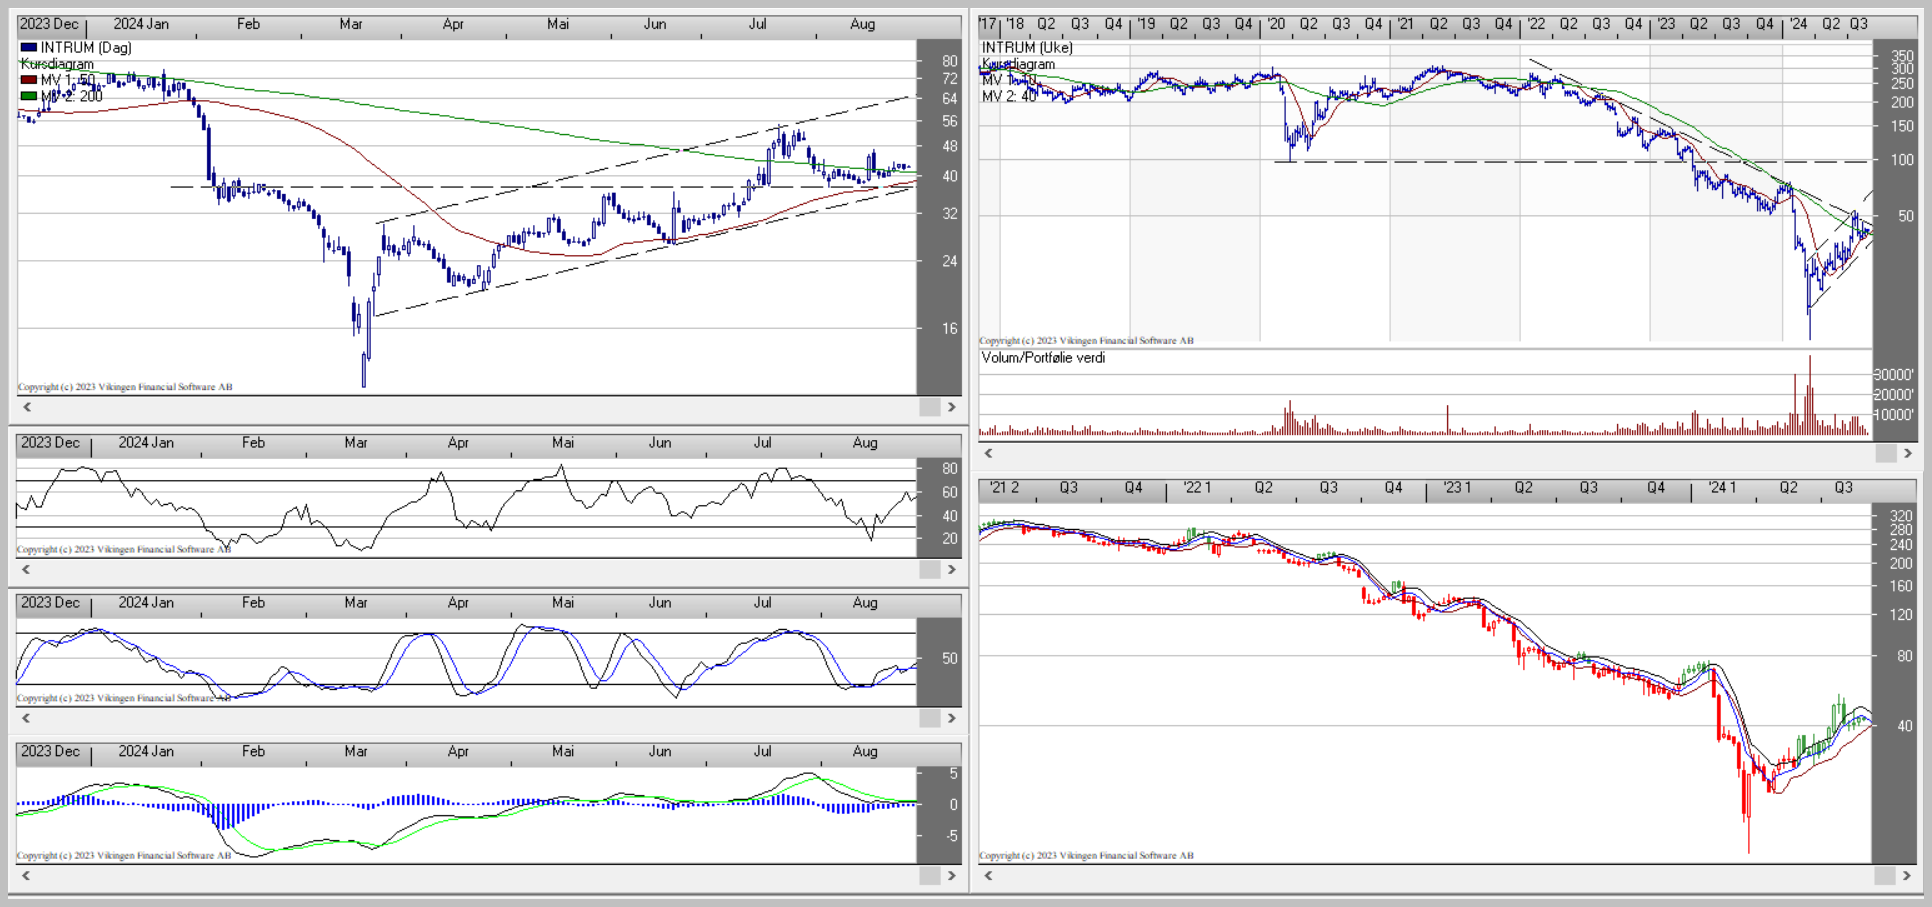
Intrum has shown a weak development since the beginning of 2022 until March 2024, when the share fell from approximately SEK 300.00 to SEK 12.00. However, the Intrum share has developed much more positively since the bottom mark in March 2024, and a rising trend has now been established for the share. The stock is consolidating in the very short term, and has also broken up above both the 50-day and 200-day moving averages.
The BEST model in Vikingen shows a buy signal for the Intrum share
Furthermore, the 50-day moving average is close to breaking above the 200-day moving average (the so-called ‘Golden Cross Signal‘). This helps to confirm that both the short-term and medium-term trends for Intrum shares have now turned from negative to positive. According to the rising trend, further increases are signaled for the share in both the short and medium term. A rise to around SEK 100.00 is indicated in the 6-12 month term, in line with the rising trend now established for the share over the past six months.
Various momentum indicators such as RSI, Stochastics and MACD also signal a further increase for the share in the short term.
This, together with the fact that the stock is now finding significant technical support around the 50-day and 200-day moving averages, gives an overall very positive technical picture for the Intrum stock.
The BEST model in Vikingen is also showing a buy signal for the Intrum stock.
This popular and effective technical analysis model has been developed by Peter Östevik. He finalized the BEST model around 2019, after 30 years of experience with technical analysis and Vikingen Financial Software.
Based on this overall positive technical picture that Intrum AB (INTRUM) shows, StockCharts365.com rates the stock as an interesting buy candidate around the current price level.
What could potentially change the positive technical picture could be if the share were to break down below the 50-day and 200-day moving averages, and down through the lower trend line in the rising trend. In other words, a break down below the SEK 35.00 level.
What is Vikingen Investment School?
Vikingen Investment School started 13. May 2024.
We have chosen to invest SEK 10,000 and hope that you will join us to learn how to get rich(er) in the stock market.
Our ambition is that you will want to join us on our journey from beginner to experienced investor.
If you have more than SEK 10,000 to invest, it’s of course even more interesting, but the principles are the same.
Since 10/6, we’re adding even more value to the blog by adding “Analysis of the week” from StockCharts365. com.
Vikingen Financial Software shows the way!
Through Vikingen Financial Software and our mentor Peter Östevik, we at Vikingen Investment School select the shares/other investment objects that are most worth buying here and now.
Vikingen Financial Software would like to remind you that past positive results do not always indicate future profits and that all trading is at your own risk.
Sincerely, Catrin Abrahamsson-Beynon