Fibonacci arcs and Fibonacci Retracement
Fibonacci arcs and retracements are used as a technical indicator to determine support and resistance. As with most indicators, it can be used to see if a breakout has occurred or if a reversal is likely to occur.
Fibonacci number
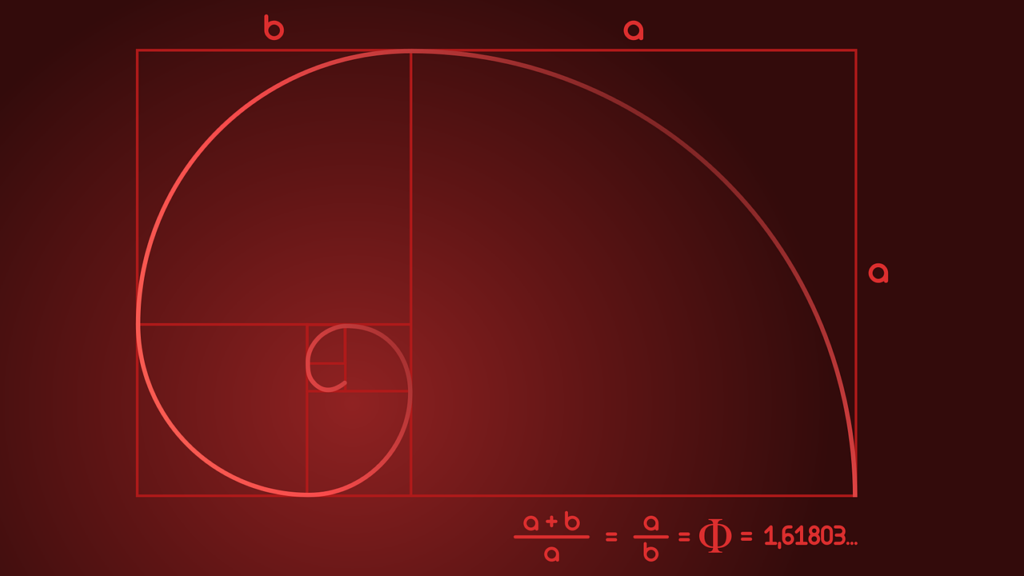
To understand the Fibonacci arcs and retracements, we must first understand where the Fibonacci numbers come from. The Fibonacci numbers are found by starting with 1,1. The next number in the sequence is found by adding the previous two numbers. To see it in action, consider this sequence of Fibonacci numbers: 1,1,2,3,5,8,13,21,34,55,89,144,233,377,610,987,1597 To get them, we go like this: – 1 + 1 = 2 – 1 + 2 = 3 – 2 + 3 = 5 – 3 + 5 = 8 – 5 + 8 = 13 – 8 + 13 = 21 – 13 + 21 = 34 – 21 + 34 = 55 – 34 + 34 = 55 – 34 + 55 = 89 – 55 + 89 = 144 – 89 + 144 = 233 – 144 + 233 = 377 – 233 + 377 = 610 – 377 + 610 = 987 – 610 + 987 = 1597 We can use these numbers to determine ratios. As the numbers in the sequence get larger, the ratio between them converges to a constant. These ratios form the basis of the Fibonacci arcs and retracements. By dividing a number by the number after it (ex:610/987) we get 0.618. By dividing the number by two after it (ex:610/1957) you get 0.382. By dividing a number by the number before it, we get 1.618. Note: Other numbers can also be found by varying the numbers we use in the sequence. These numbers are extremely important not only in economics, but also in nature and can be seen almost everywhere. (1.618 and 0.618 are called the “golden ratio” because 1/1.618 = 0.618 among other things). In statistics, the percentage of a sample population found in a normal distribution within half a standard deviation is 38.2% (which is what you get when you divide a Fibonacci number by two before it). The sheer amount of times we see these numbers in nature and elsewhere is enough to give some credit to the use of the Fibonacci sequence.
Fibonacci Retracement
This tool, although less useful than the Fibonacci arc, can be used to determine likely support and resistance levels and can also help with previous chart patterns. Drawing lines at the highs and lows and at 38.2% 50% and 61.8% will provide important support and resistance. As we can see below, although useful, the retracement only provides so much information and is generally less useful than drawing your own support and resistance lines.  What’s important here is that you can see is that on the way down the stock went through three lines very quickly but stayed in the upper and lower levels for quite some time.
Fibonacci arcs
Fibonacci arcs are much more useful because they take time into account as well as price.  From this graph we can see that the arc follows the 61.8% line very closely before cutting into the next percentage area. This is very predictable as it could not possibly continue to rise at the rate it was and was a support arc for that period. As with most technical indicators, Fibonacci Arcs and retracements are one tool among many others. They can provide a lot of information in one graph and very little in another. What is important to note is that it is very unlikely for trades to go from the 100% arc to the 50% arc without some time passing.
About the Vikingen
With the Viking’s signals, you have a good chance of finding the winners and selling in time. There are many securities. With Vikingen’s autopilots or tables, you can sort out the most interesting ETFs, stocks, options, warrants, funds, and so on. Vikingen is one of Sweden’s oldest equity research programs. Click here to see what Vikingen offers: Detailed comparison – Stock market program for those who want to get even richer (vikingen.se)


