Analysis of the Week – an electronics chain on Nasdaq Copenhagen!

Aksjeanalyser.com takes a closer look at an electronics chain!
In this Analysis of the Week, Aksjeanalyser.com takes a closer look at Bang & Olufsen.
(Ticker on Nasdaq Copenhagen: BO).
The stock has shown a strong development in recent months and has now triggered a new strong technical buy signal.
Read more about the stock below in this week’s Analysis from Vikingen Financial Software and Aksjeanalyser.com.

About the company Bang & Olufsen
(Ticker on Nasdaq Copenhagen: BO).
Bang & Olufsen is an electronics chain. They develop, manufacture and sell electronic products for home use. The product portfolio include televisions, stereos, home theater systems, speakers and telephones. Customers include private individuals as well as small and medium-sized corporate customers in various sectors. Operations take place on a global scale and the head office is located in Struer.
For more information about the company, visit their website here.
Technical Analysis of Bang & Olufsen
(Ticker on Nasdaq Copenhagen: BO)
The Bang & Olufsen share has shown strong development in recent months and has now triggered a strong technical buy signal after breaking upwards from a large rectangle consolidation formation (see weekly chart).
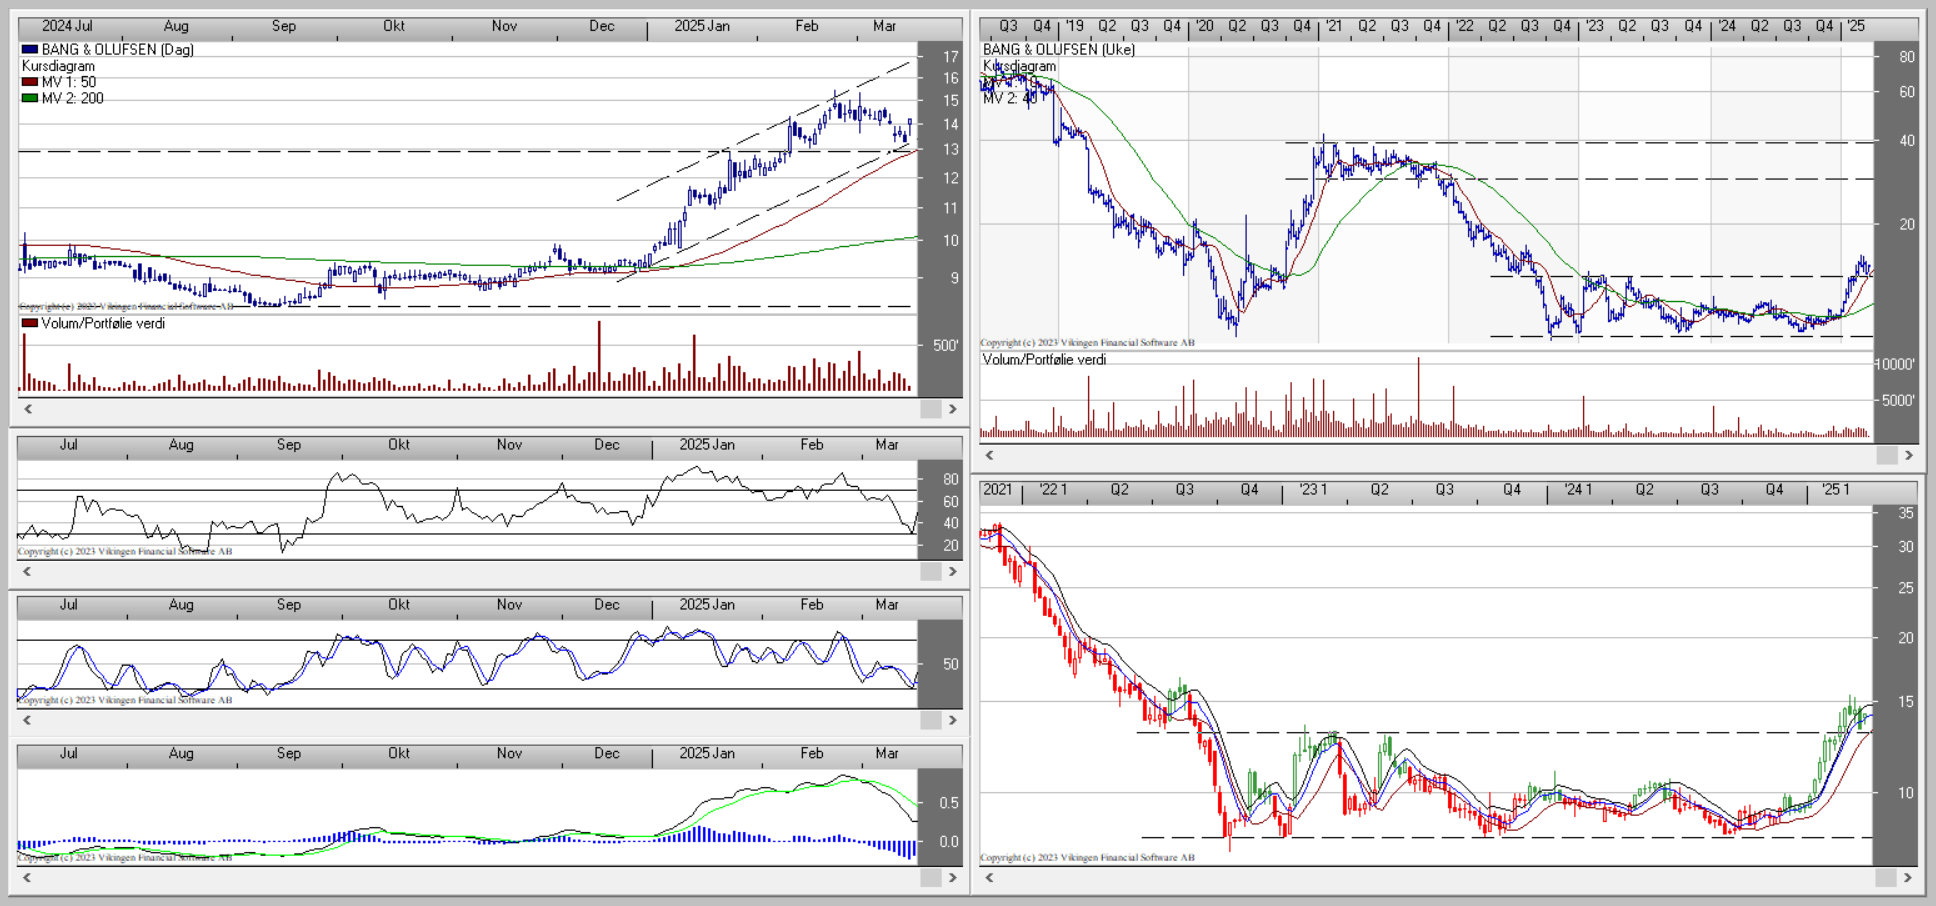 The Bang & Olufsen share fell from a peak of around DKK 80.00 in early 2018 to a low of around DKK 8.00 in early 2020. It then rose sharply to DKK 40.00 in less than a year, and from the beginning to the end of 2020.

Subsequently, the share fell sharply again from the DKK 40.00 level at the beginning of 2021 to around DKK 8.00 at the end of 2022.
The share has then consolidated between DKK 8.00 and 13.00 from autumn 2022 until autumn 2024. BO has shown a strong performance in recent months, and has now broken out of this major two-year consolidation formation.
The stock has had a consolidation and short-term correction down, but has found good technical support around the 50-day moving average and down towards the now significant technical support level around DKK 13.00.

Various momentum indicators such as RSI and Stochastics are now signaling further gains for the stock.
There is now little technical resistance for the stock, and the overall technical picture signals a potential for the stock to reach up to DKK 30.00 – 40.00 in 12-18 months’ time.

The BEST model gives a green light to Bang & Olufsen!
The BEST model in Vikingen is also in a buy signal for the Bang & Olufsen share. This popular and effective technical analysis model was developed by Peter Östevik. He finalized the the BEST model around 2019, and after 30 years of experience with technical analysis and Vikingen Financial Software.
What could potentially change the current positive technical picture that the stock is showing is if it were to fall back below the now important and significant technical support level around DKK 13.00, and establish itself below that level and below the 50-day moving average.
Based on the overall positive technical picture that the stock now shows, Aksjeanalyser.com considers the Bang & Olufsen stock to be an interesting and exciting buy candidate at the current price level of around DKK 14.00.

Soon to be launched – Top 10 Buy Signals from Vikingen!
Every week, you will soon have access to the 10 most attractive stocks from Vikingen and the BEST Model.
Completely free! So now it’s more important than ever to follow us on social media: FB, Linkedin or X so you don’t miss out on anything. Tell your friends and colleagues to follow us too!
To get access to the BEST Model in Vikingen you need Vikingen Exchange, Vikingen Trading or Vikingen Maxi.
Do you already have Vikingen, but want an interesting addition? See all the additions here.
Maybe you want all shares on Nasdaq? Purchase here!
Here you can watch free trainings (in Swedish) about Vikingen Mini, Exchange,Trading and Vikingen Maxi programs.
Vikingen Financial Software reminds you that past positive results do not always indicate future profits and that all trading is at your own risk.
Sincerely yours