The head and shoulders pattern is one of the most popular chart patterns in technical analysis. Its popularity is mainly because it is easier to spot than […]
What does head-shoulder mean in technical analysis?

The head and shoulders pattern is one of the most popular chart patterns in technical analysis. Its popularity is mainly because it is easier to spot than […]
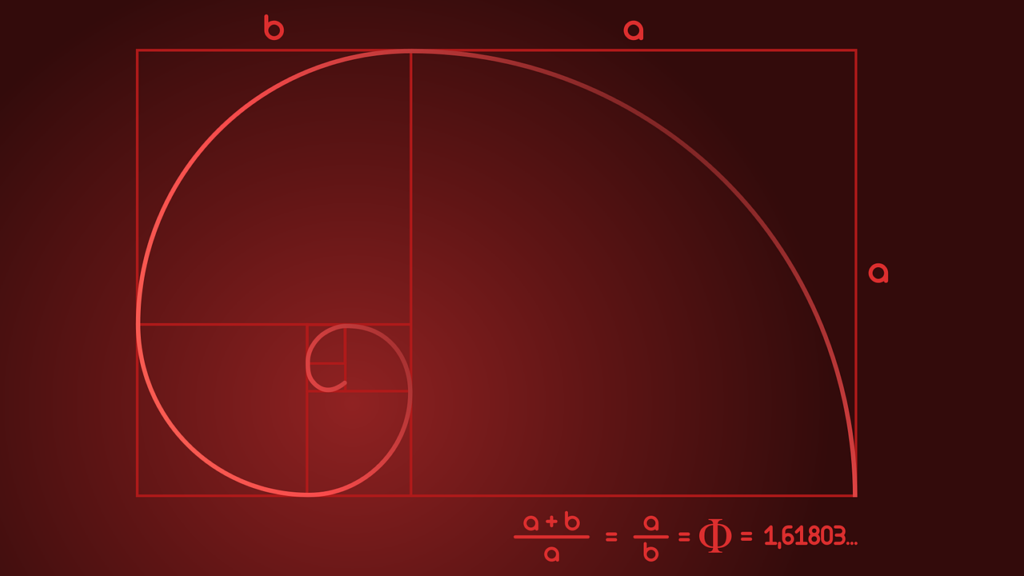
Fibonacci arcs and retracements are used as a technical indicator to determine support and resistance. As with most indicators, it can be used to see if a […]

A double bottom is a reversal pattern very similar to the reverse head and shoulders pattern and is often seen when trading currencies. Double bottom patterns are […]
Speculation: One advantage of using options is the reality that you will not be limited to making a profit only when the market is successful. Because of […]

Learn the classic market cycles of accumulation, marking up, distribution and mark down so you can time the market – consistently – and make steady profits at […]

Definition: The DIA -DIAMOND Trust, Series 1 ETF invests in a basket of Dow Jones Industrial Average stocks that will track the price and performance of the […]

The correlation between US stocks and bonds over the last 3 years (0.73) is the highest ever. Source: Charlie Bilello Viking offers price data on US stocks […]

Definition: Bear ETFs short stocks to achieve their objectives. Bear ETFs show gains when the underlying stocks lose value. Bull ETFs use long positions and show gains […]

The average individual investor is saving for retirement, a house, travel money or some other goal. They want some certainty that the money they put back now […]

Options generally give a person the right but not the obligation to buy or sell whatever the contract was created for. For example, an option on a […]