Currency trading with Bollinger Band
Many new traders think they need more indicators to be a consistently profitable trader. But the truth is that it doesn’t work like that. Imagine this: The price is above 20 MA but the RSI shows that the market is overbought. At the same time, the ADX indicator is at 25 showing a non-trending market. So, which one do you follow? Now you’re stuck, right? The good news is that the Bollinger Band can help you solve the problem and much more.
Bollinger Bands explained: What is it and how does it work?
Bollinger Bands is a trading indicator consisting of 3 bands created by John Bollinger. It can help you to: 1. Identify potential overbought/oversold areas 2. Identify the volatility in the markets
“What do the three bands mean?”
Upper band – Middle band plus 2 standard deviations Lower band – Middle band minus 2 standard deviation Middle band – 20 period moving average In our examples we have used the default settings for Bollinger Bands which are the 20 period moving average and 2 standard deviations for the upper and lower band.
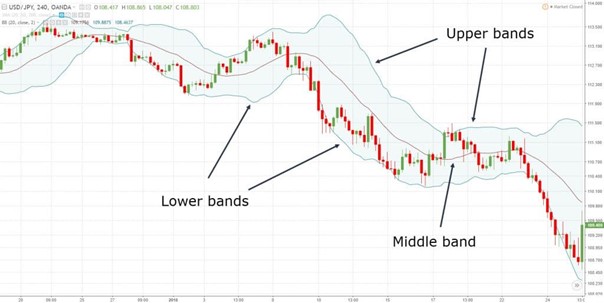 What is standard deviation?
It basically measures how far you are away from the average. If the price is close to the upper Bollinger band, it is considered “expensive” because it is 2 standard deviations above the average (the 20-period moving average). And if the price is close to the lower Bollinger band, it is considered ‘cheap’ because it is 2 standard deviations below the average. Here is an example: 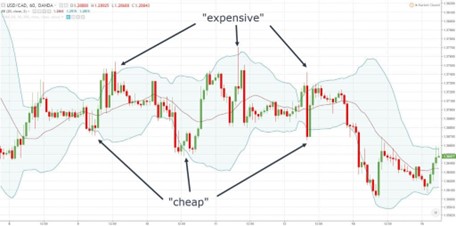
Don’t make this mistake when trading with Bollinger Bands
Just because the price seems “cheap” or “expensive” does not mean you should take a position immediately. In trending markets, the market can remain “cheap” or “expensive” for a long time. Here is an example: EUR/USD remained “expensive” for many months… 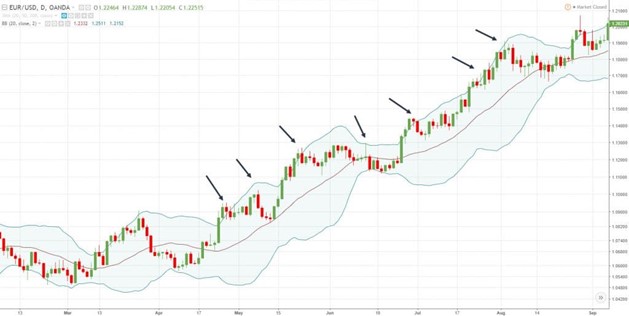 As you can see, going short when the price is in the upper bands can be painful. So what should you do?
Bollinger Bands Trading Strategy: How to Buy Low and Sell High
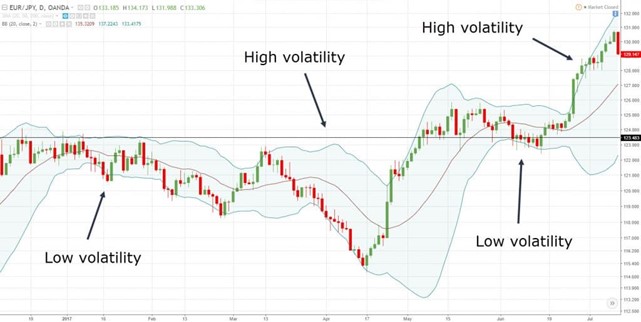
You’ve probably heard this a gazillion times. If you want to make money in the markets, just buy low and sell high. But the question is… HOW? You can do it with Bollinger Bands. The outer Bollinger Bands are two standard deviations from the mean. This means that if the price is in the lower band, it is considered “cheap”. And if it’s in the upper band, it’s considered ‘expensive’. But before you think… “Great! I’ll buy when the price reaches the lower band. “ If you want a higher probability of success, you need some confluence factors that come together before changing bands. For example: – Make sure to extend the lower band in an uptrend (and vice versa) – Reverse candle stick pattern showing signs of reversal – The outer bands coincide with support and resistance Here’s an example: The price of EUR/USD is in the lower Bollinger band that coincides with the support line and the Bullish Engulfing pattern formed. 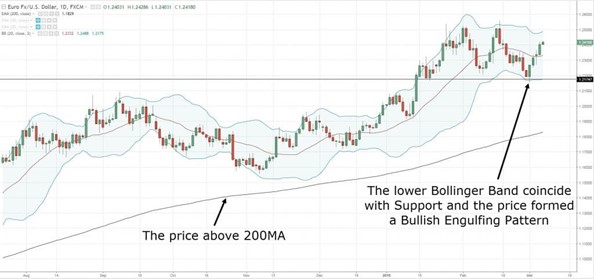 You can adjust your Bollinger Bands settings to 3 standard deviations (or more) to identify even more overbought/oversold levels. Bollinger Bands Squeeze: How to identify explosive breakout trades that are about to occur Volatility is always changing. Markets go from a period of high volatility to low volatility (and vice versa). If you’re new to trading, it can be difficult to identify market volatility. So this is where Bollinger Bands can help as they contract when volatility is low and expand when volatility is high. Here is an example:
  So the question is how do you use Bollinger Bands to anticipate a possible breakout? You look for Bollinger Bands to contract (or squeeze) because it tells you the market is in a low volatility environment. Why? Because volatility tends to expand after contraction! An example: Before the breakout, crude oil is in a low volatility environment (as shown by the contraction of the bands).
 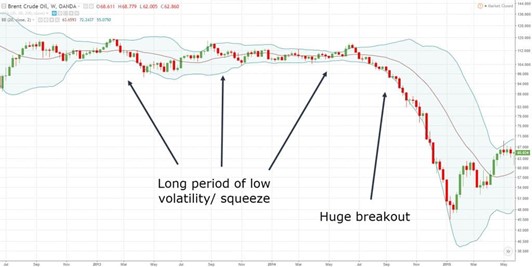 The longer the drop in volatility, the stronger the subsequent breakout.
How to identify the direction of the breakout
Although Bollinger Bands can warn you of potential breakout trades, it doesn’t tell you the direction of the breakout. However, you don’t have to be Einstein to figure out where the market is likely to go. Because all you have to do is look at the trend. Look at the chart below: 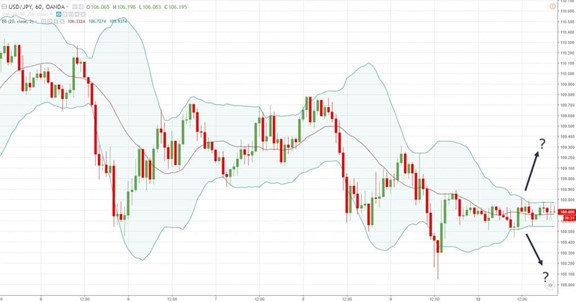 Where do you think the market is likely to break out, higher or lower? Probably lower because the trend is downward. And you are right because the market went down.
 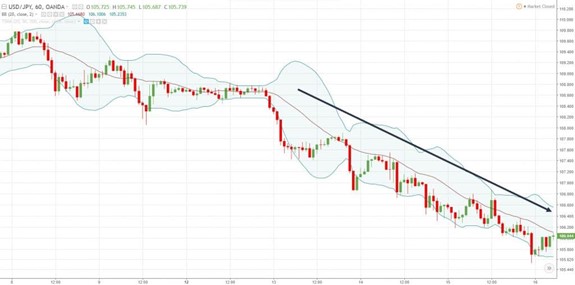 Simple yet powerful, right?
How to trade with the trend of Bollinger bands
You know that the centerline of the Bollinger Bands is simply a 20-period moving average (otherwise known as the mean of the Bollinger Bands). In strong trending markets, the 20-period moving average can act as a “value area”. This means that when the market moves back towards the 20 MA, it’s an opportunity for you to get long (or short). An example: The price bouncing off the 20-year moving average and it offers shorting opportunities 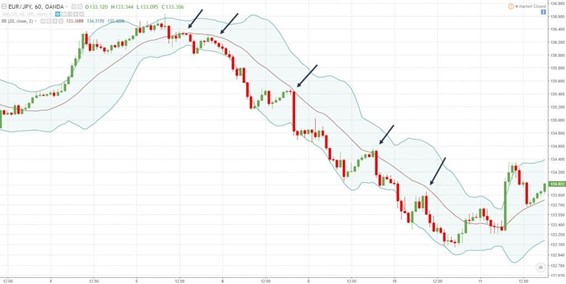 Here is another example
 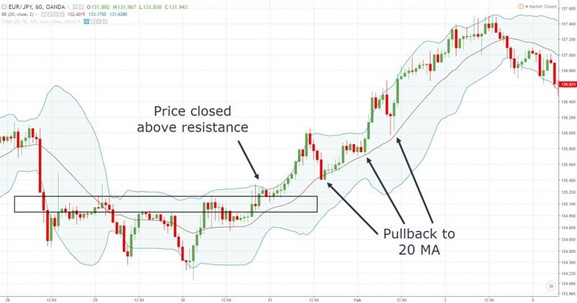 If you want to ride the trend, you can track your stop loss using the 20 MA or the outer Bollinger bands, this is known as trailing stop loss.
Bollinger Bands and RSI Combo (little known technique)
Here’s how it works: The Bollinger Bands indicator is great for identifying areas of value on your chart. But the problem is that it doesn’t tell you the strength or weakness behind the movement. For example: How do you know if the market will continue to trade outside the outer bands or if it means a pullback? That’s where the RSI (Relative Strength Index) indicator comes in. What you are looking for is a deviation from the RSI indicator.
What is an RSI deviation?
1. A bearish divergence is when the market makes a higher high, but the RSI indicator shows a lower high (a sign of weakness) 2. A bullish divergence is when the market makes a lower low, but the RSI indicator shows a higher low (a sign of strength) So now the question is how do you combine RSI divergence with Bollinger Bands?” If the price is at upper Bollinger bands, you can look for a bearish RSI divergence to indicate weakness in the underlying move. Or… If the price is at lower Bollinger Bands, you can look for bullish RSI divergence to indicate strength in the underlying move. Here is an example: 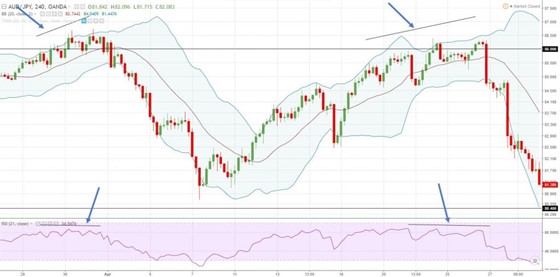 You can combine this technique with support and resistance to find higher probability conversions.
The Rubber Band Effect: How to use Bollinger Bands and “predict” market turnaround
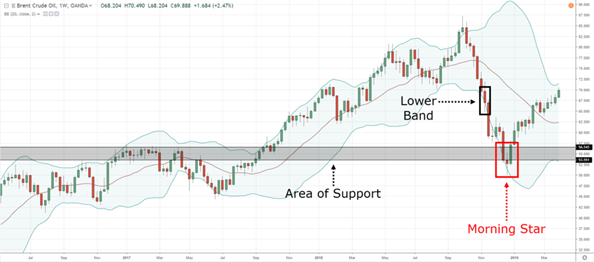
You can think of Bollinger Bands as a rubber band. Whenever price gets too far away from it, it tends to mean that you are reverting towards the middle band. You also need to take into account Bollinger Bands, Support Resistance and Candlestick patterns. Here’s how it works… (For long setups) 1. Look for strong momentum in Support 2. You want to see the candle close outside the lower Bollinger Bands (this tells you the market is overextended) 3. If the next candle is a bullish reversal pattern (like Hammer, Bullish Engulfing, etc.), the market is likely to reverse higher 4. And vice versa for short setups Here’s an example. The price of EUR/CHF bounced off the support 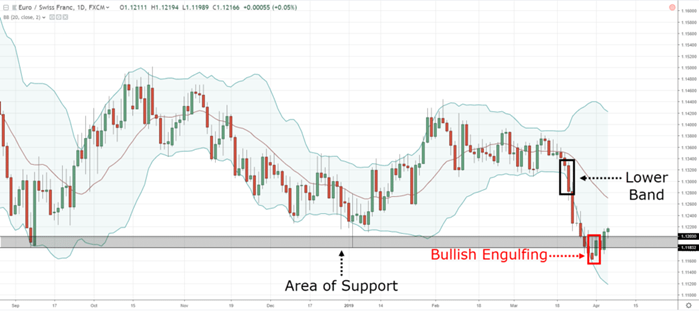 The price bounced off the support in Brent Crude
  By default, the outer bands are two standard deviations from the center band (20MA). If you want to identify even more congested market conditions, you can increase the standard deviation to 3 or more. There is really no best time frame out there for using Bollinger Bands because these concepts can be applied in different time frames. So it depends on your trading style and strategy: If you are a day trader, you will use Bollinger Bands on the lower time frame like the 15-minute or 5-minute time frame. If you are a swing or position trader, you will use Bollinger Bands on the daily or weekly time frame. An accumulation stage is a market within a downtrend, where you can identify resistance and support as the price swings up and down within the accumulation. While a Bollinger Bands squeeze, the market doesn’t swing up and down because the price action gets really tight and the candles overlap. So it is impossible to identify support and resistance in a Bollinger Bands squeeze. Bollinger Bands can also work for both breakout and reversal trades. Conclusion – The Bollinger Bands indicator can help you identify when the market is “cheap” or “expensive” – In an uptrend, you can long near the lower Bollinger band – In a downtrend, you can go short near the upper Bollinger band – When the Bollinger Bands are in a squeeze, it signals that the market is “ready” for breakout – You can use the 20-period moving average to get your entries in the trending market – You can use Bollinger Bands and RSI divergences to find high probability reversal trades – You can use Bollinger bands and support and resistance to “predict” market transformation
About the Vikingen
With the Viking’s signals, you have a good chance of finding the winners and selling in time. There are many securities. With Vikingen’s autopilots or tables, you can sort out the most interesting ETFs, stocks, options, warrants, funds, and so on. Vikingen is one of Sweden’s oldest equity research programs. Click here to see what Vikingen offers: Detailed comparison – Stock market program for those who want to get even richer (vikingen.se)


