Bitcoin in this week’s analysis by StockCharts365.com!
In this week’s Analysis by StockCharts365.com, Bjørn Inge Pettersen takes a closer look at Bitcoin (BTC/USD)!
As you probably know, Bitcoin has shown a strong growth recently, and the price of one bitcoin is now very close to the magical USD 100,000 mark! So what now? Should we just jump in and buy bitcoin here around USD 100,000, or will there be a sharp correction downwards for bitcoin from the USD 100,000 level?
Read more about Bitcoin below!
Vikingen Investment School uke 48!
Below you will find our comments for week 48, BLACK WEEK. Don’t miss out on Vikingens offers! 40% off everything in the entire webshop 25-29/11. Use code BLKWEEK2024. Welcome to Vikingen!
MPC Container Ships we chose to keep, a good long-term stock that we believe can handle the turbulence in the world
NVIDIA we chose to keep NVIDIA, which went against forecasts and rose!
We have now earned over 10% on NVIDIA and over 15% on MPC!
But we’re keeping a close eye on NVIDIA and watching how MicroStrategy A (MSTR) develops!
In this presentation you can listen to Peter Östevik and Aktieutbildning.nu to find out which stocks are the Best Buy right now. Recorded 19/11 in the evening. All analysis done with the help of Vikingen Financial Software.
We’ve learned to follow developments more closely than before and to be prepared to buy or sell.
It was our investment school of the week. Feel free to give us feedback and follow us on FB and/or Linkedin.
Technical Analysis of Bitcoin below!

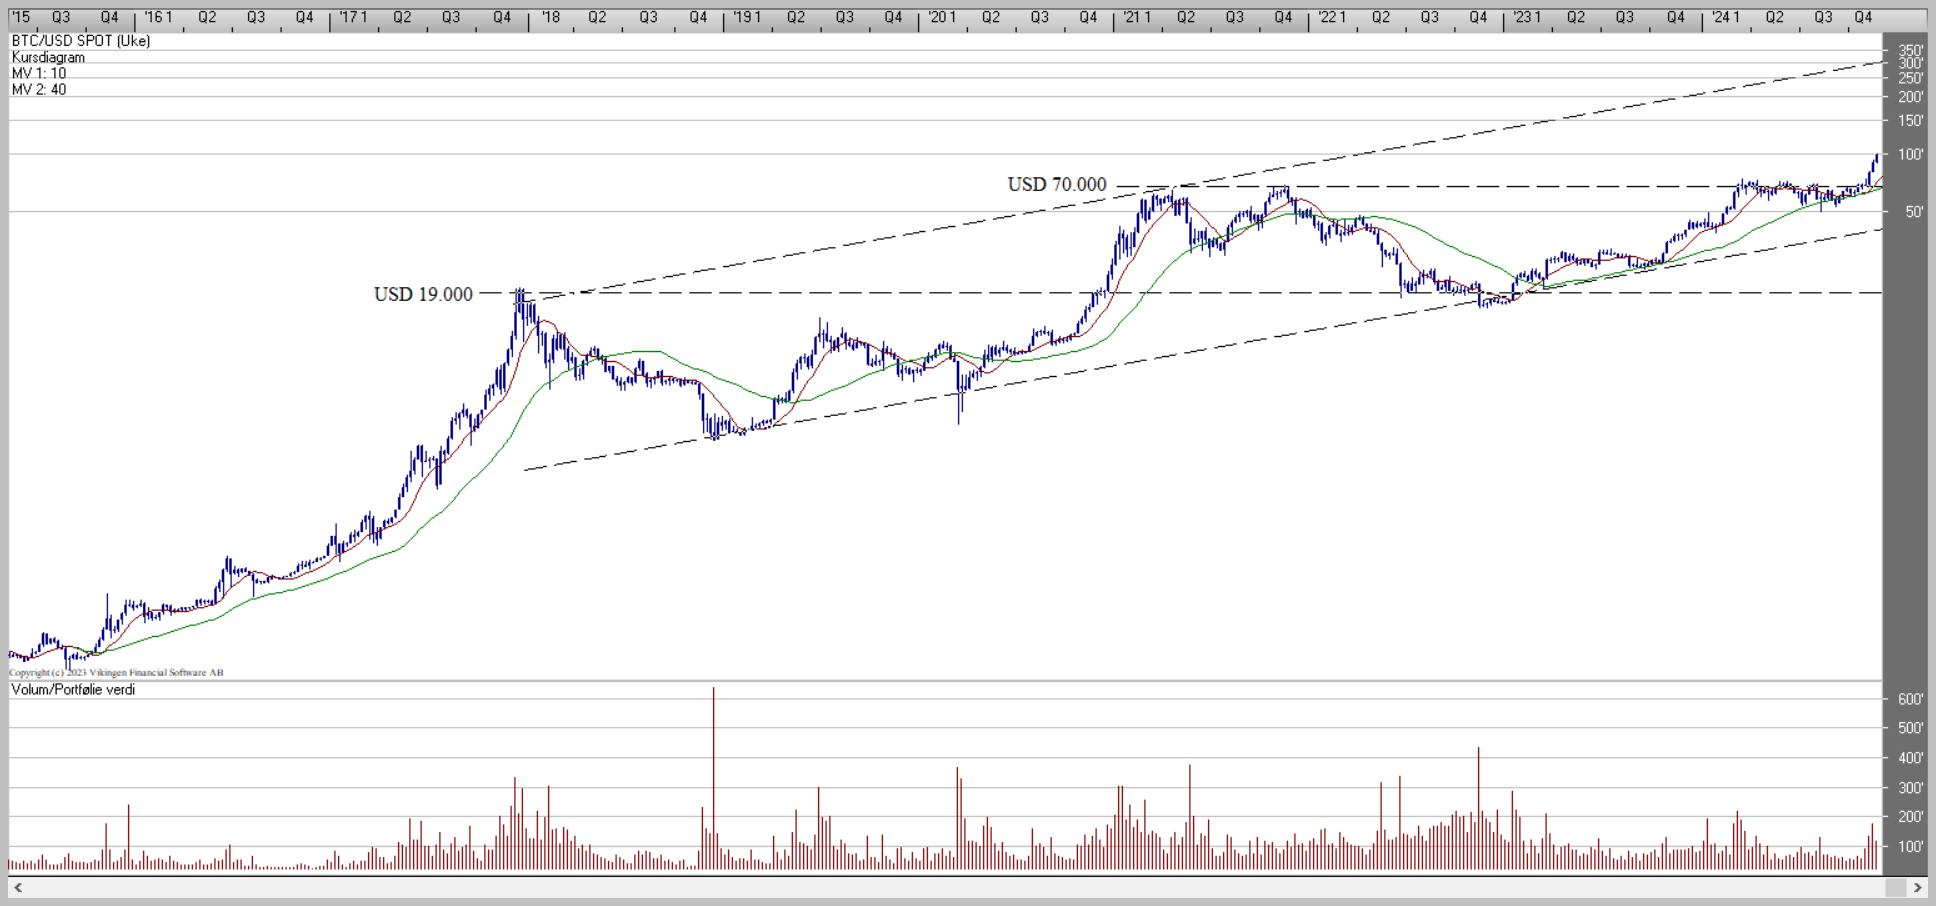
Bitcoin is moving within a rising trend (BTC/USD)!
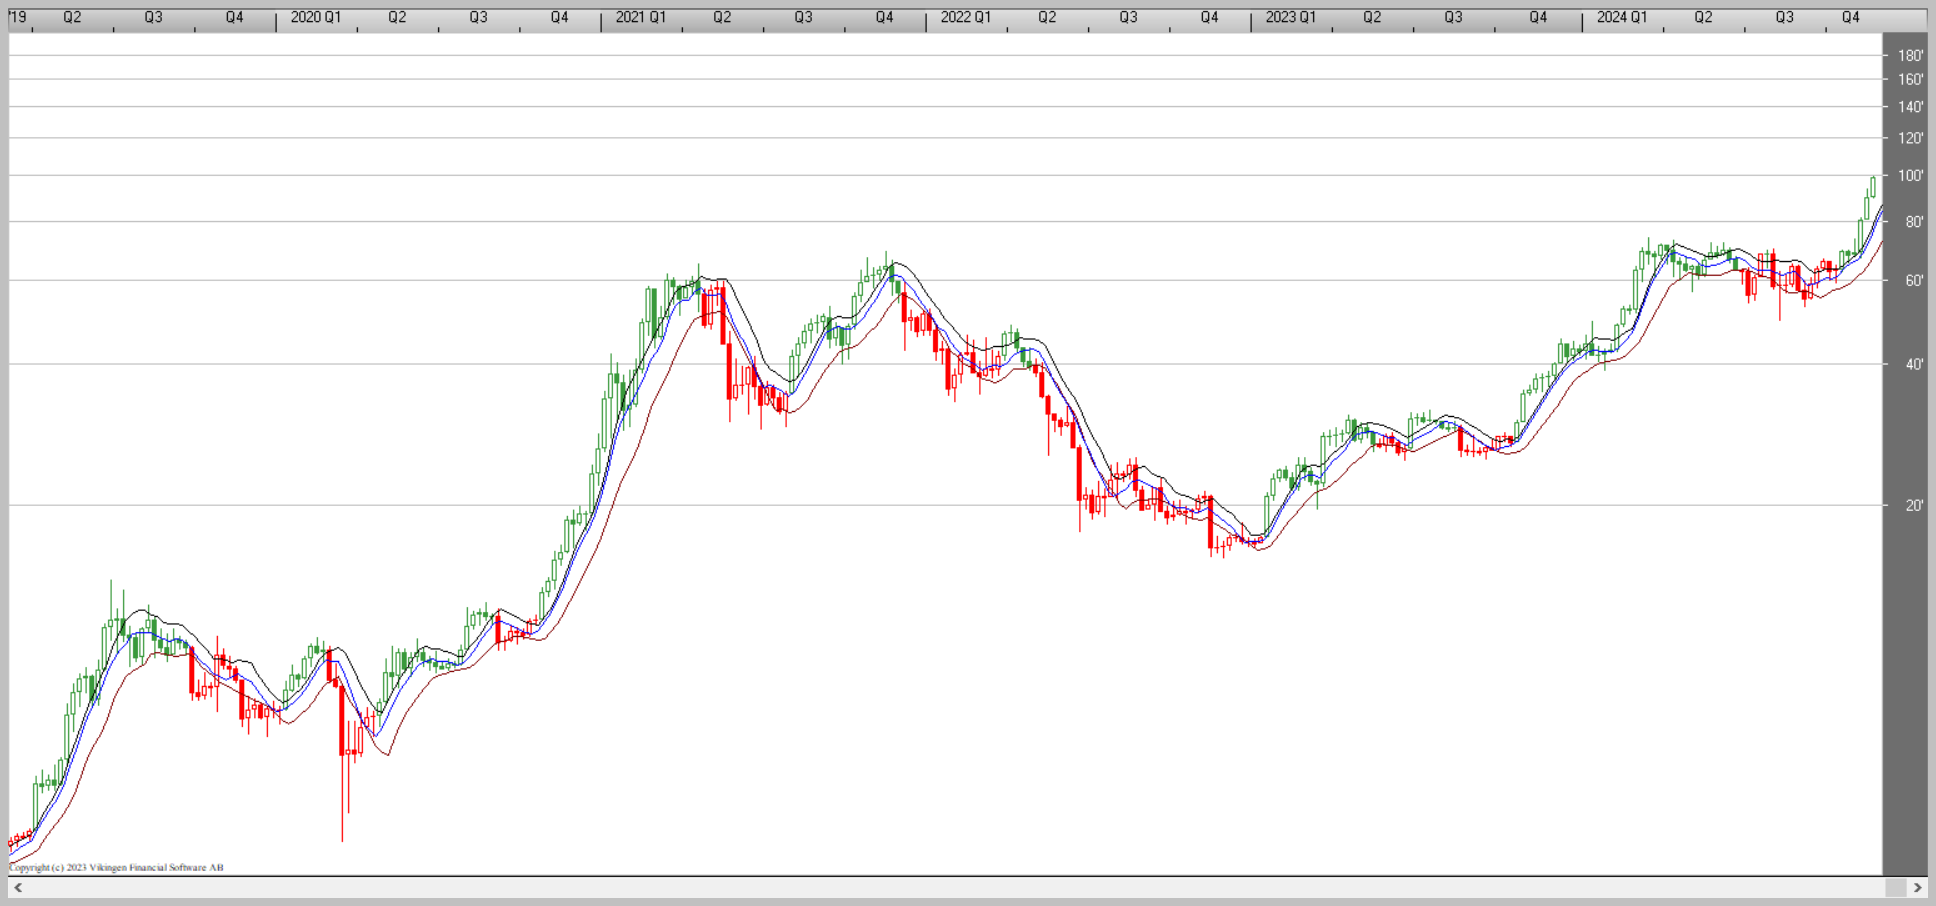
Bitcoin is moving within a long-term rising trend and has recently triggered a strong technical buy signal. When bitcoin recently broke above the previous all-time high, around USD 72,000, a strong technical buy signal was triggered. Bitcoin then consolidated for a long time (March – October 2024) between USD 52,000 – 72,000. There is now little technical resistance for a further rise within the long-term rising trend, which now indicates a potential for bitcoin to reach around USD 300,000 – 500,000 in a period as short as 6-12 months!

StockCharts365.com sees the potential, as does the BEST model
The BEST model in Vikingen is also in buy signal for Bitcoin. This popular and effective technical analysis model was developed by Peter Östevik. He finalized the BEST model around 2019, after 30 years of experience in technical analysis and Vikingen Financial Software.
Even though Bitcoin has shown a strong development recently, it is still no higher here around USD 98,000 than about 40 percent above the previous all-time high back in the beginning and end of 2021, where it was around USD 70,000 – 72,000. So if you’re struggling with fear of heights, when Bitcoin is around USD 100,000, you should rather look at the long-term rising trend that Bitcoin is moving within, and where a strong technical buy signal has been triggered.
According to the long-term rising trend, the potential for bitcoin indicates that it could be up to around USD 300,000 – 500,000 in as short a time as 6-12 months. What could potentially change the currently very positive technical picture for bitcoin would be if the currency were to make an established break below the now massive technical support area around USD 70,000.

New share issue in 3PI with the aim of further developing Vikingen!
We welcome the public to purchase shares in 3PI during the period 18/11 to 13/12 2024. The purpose of the share issue is to finalize a new and more user-friendly technical platform in Vikingen Financial Software AB through a capital injection.
Read all details in the memorandum and in our presentation via this link.
You are welcome to contact Lars Sennergren at 3PI for more questions about the share issue!
What is Vikingen Investment School?
Vikingen Investment School (which we talk about in this blog) started May 13, 2024. We have chosen to invest SEK 10,000 and hope that you will join us to learn how to get rich(er) on the stock market. If you have more than SEK 10,000 to invest, it’s of course even more interesting, but the principles are the same. Through Vikingen Financial Software and our mentor Peter Östevik, we select the investments that are most worth buying and selling right now.
Since June 10th, we have added even more value to the blog by giving you the “Analysis of the week” by StockCharts365 .com. And since week 41 there has been a link to Stockchat in this blog. Stockchat is free, every Wednesday from 7-8 pm CET. In Swedish.
Vikingen Financial Software reminds you that past performance does not always indicate future profits and that all trading is at your own risk.
Sincerely
Catrin Abrahamsson-Beynon


