In this week’s Analysis with Stock Tip, stockcharts365.com looks at Bitcoin!
Welcome to the Investment School and Analysis of the Week with Stock Tips week 27!
StockCharts365.com analyzes the world’s most popular cryptocurrency, Bitcoin (BTC/USD).
Below you see the “Analysis of the week with stock tips” from Bjørn Inge Pettersen from StockCharts365. Today StockCharts365.com has done an analysis on the world’s most popular cryptocurrency, Bitcoin (BTC/USD). What’s the view of StockCharts365. on the currency’s future development? Read more below!
First, join us for a review of Investringsskolan’s holdings, as we enter week 27.
Holdings of the investment school
Hexatronic (HTRO), we choose to hold until it meets its resistance at SEK 61.80. We will sell at about SEK 61 and then make a small profit.
As mentioned, BankNordik P/F shares are very still but have gone up last week and today a little more. We have not been able to sell the stock, as it is under-traded. A good reminder not to buy shares where the volume is too low. We will try to sell when the opportunity arises and buy something that has more upward trend and greater volume.
Per Aarsleff Holding we are keeping this well-run company which is still showing a good forecast going forward, and going up a bit more today.
MPC Container Ships a Norwegian share that we choose to keep. They have very high occupancy on their ships and we have received a new buy signal in Vikingen. We might purchase some more.
BioInvent (see previous Analysis of the Week below by StockCharts365.com) we bought and sold again at SEK 39 as the stock went up and stayed at a resistance and then went down again.
Svitzer Group A/S The core business of this Danish shipping company consists of services in towing and assistance to seagoing vessels to maneuver in and out of ports and terminals. This we bought some of and choose to keep. The long-term trend is upwards.
This was the investment school week 27. Feel free to give us feedback and follow us on FB and/or Linkedin. All analysis is done via Viking Financial Software. Next week (week 28) we will publish as usual, but week 29 we will be on vacation.
The world’s most popular cryptocurrency, Bitcoin (BTC/USD)
Technical analysis of Bitcoin (BTC/USD)
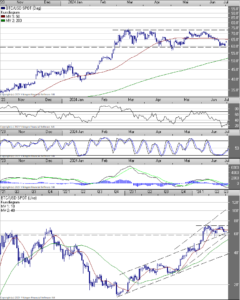
BTC/USD had a very strong run-up from late 2023 to 2024, and then broke through both the resistance level at the upper trend line of the rising trend channel, and also through a significant and very important technical resistance level around 60,000 USD (cf. weekly chart below).
In recent months, BTC/USD has consolidated above what is now a significant technical support level for BTC/USD, around $60,000.
BTC/USD is now consolidating within a large rectangle consolidation, and between the previously mentioned technical support level around $60,000 and a resistance level around $74,000.
An established breach of one of these two now-important technical levels will help to provide upcoming signals about the further development ahead for BTC/USD.
RSI and Stochastics signal further rise for Bitcoin
At the time of writing, BTC/USD is recovering slightly after being down and testing this important technical support level around $60,000. Various momentum indicators such as RSI and Stochastics are signaling further upside for BTC/USD in the short term.
The next technical resistance level is now up towards the 50-day moving average and around $65,000.
A break above $65,000 would indicate a further rise to the key technical resistance level around $74,000.
A possible break above $74,000 will trigger a strong technical buy signal for BTC/USD, with the then potentially new and steeper rising trend (cf. weekly chart above) indicating a potential for around $120,000 over the next 6-9 months.
Should there be an established break below the USD 60,000 level, further decline will be signaled and the next key technical support level will then be around the 200-day moving average, which stands at around USD 52,000.
As StockCharts365.com interprets the overall technical picture for BTC/USD today, a retest of the resistance level around $74,000 in the coming weeks seems most likely.
Therefore, should there be a break from this large rectangle consolidation, it will trigger a strong technical buy signal for BTC/USD which will then have potential up to around $120,000 in the 6-9 month term.
Valuable information on Vikingen website
The information on our website is available for you free of charge
Here are four videos recorded by our mentor Peter Östevik on technical analysis and how to best use Vikingen’s various programs, from Vikingen Mini, to Exchange, Trading and Maxi. These four films contain incredibly valuable information.
The films are in Swedish. The most purchased Vikingen program is Vikingen Exchange, which you can purchase here.
Here are 20 short, highly educational films by Uffe Raahede. The videos provide you with the information you need to get started with technical analysis and Vikingen. The films are in Danish. On the same page where you can find Uffe Raahede’s videos, there is also a webinar with Lars Persson, called “Viking Basic Course” .
What is the Vikingen Investment School?
The Vikingen Investment School started on May 13th, 2024. We have chosen to invest SEK 10,000 and hope that you will join us in learning how to get rich(er) on the stock market. Our ambition is that you will want to join us on the journey from beginner to skilled investor. If you have more than SEK10,000 to invest, it’s of course even more interesting, but the principles are the same. As of 10/6, we added more value to this blog by adding “Analysis and Stock Tips of the Week” byStockCharts365. com.
Vikingen shows the way!
Through Vikingen Financial Software and our mentor Peter Östevik, we select the stocks / other investment objects that are most worth buying here and now. Please follow us on FB and/or Linkedin
Vikingen Financial Software would like to remind you that past positive results do not always indicate future profits, and that all stock market trading is at your own risk.
Yours sincerely
Catrin Abrahamsson-Beynon


![Nasdaq Island, tidigare känd som Islandsbörsen (XICE) (isländska: Kauphöll Íslands [ˈkʰœypˌhœtl ˈistlan(t)s]), är en börs belägen på Island. Börsen grundades 1985 som ett joint venture mellan flera banker och mäklarfirmor på initiativ av centralbanken. Handeln började 1986 med isländska statsobligationer och handeln med isländska aktier började så sent som 1991.](https://www.vikingen.se/wp-content/uploads/2024/12/iceland-1995039_1280-300x200.jpg)


